MOVING FROM ANECDOTES TO STRATEGIC PERFORMANCE IMPROVEMENT
As we move into summer, we are continuing our partnership with Spinnaker Health Care Solutions to explore performance improvement tools for use in your stroke program. One of the most common errors we witness in regular stroke program meetings is presenting program data without an analysis of the problem and proposed interventions to address the problem. Presenting data often triggers team members to begin sharing their experiences with the topic, and the conversation can quickly dissolve into shared anecdotes. The problem with anecdotes is they often don’t provide reliable data to inform decision making. Many errant PI interventions developed from anecdotal experiences. This approach can be costly and time consuming. The experienced program leader is adept at PI tools that help analyze performance data and guide the team in choosing next steps wisely. With the right tools, you can move from identifying a problem to confidently choosing the best next intervention.
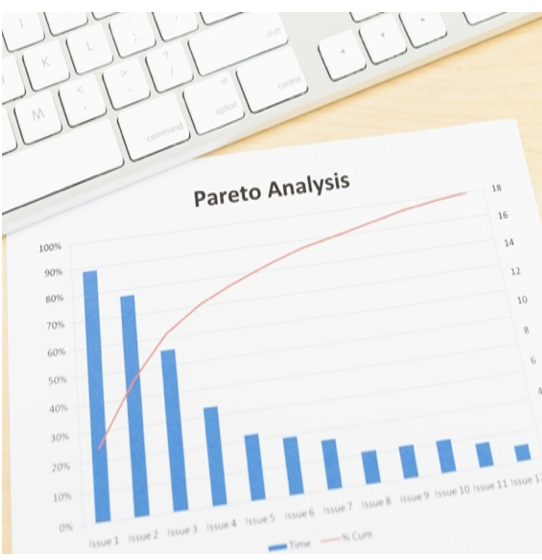
In this webinar, we will explore several tools in detail, including process mapping, fishbone analysis, the 5-whys root cause analysis, a PICK Chart and a Pareto Chart. These tools equip the healthcare team to analyze causes of a problem and choose the best next step. In addition to learning when to use these tools and how to analyze the data provided, you will also learn how to build a pareto analysis in Excel. Using a few simple graphing keystrokes, you will be building pareto charts in no time.
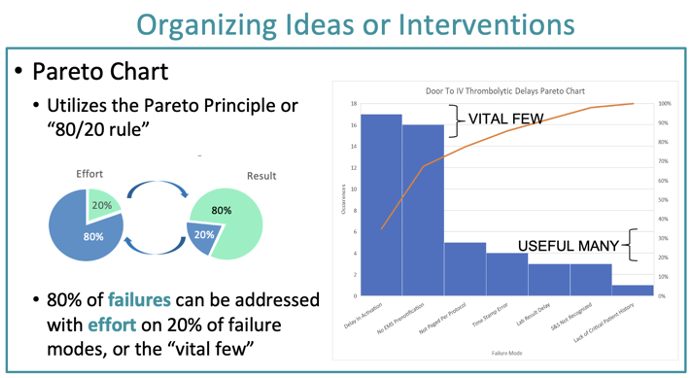
We developed an Excel tool and training webinar to help you learn how to build and master Pareto charts. We give you an Excel template already populated with the “mock” data. The webinar walks you through building a Preto chart with the Excel template. You can also cut and paste your Stroke Log data into the Excel template and build a Pareto chart displaying your own data! Learn more about the webinar here.
We offered this training in a virtual workshop in June and got some great feedback that we’d like to share with you:
“Appreciate these trainings which are very helpful for both new and experienced stroke coordinators, managers, and stroke leadership.”
“This workshop was definitely helpful in determining when to use certain process improvement methodologies or tools to analyze data and trends!”
“Great work on the workshops! Thank you for continuing to put out such relevant and relatable material!”
“I enjoyed the demo of building/using a pareto, especially knowing that I have instructions and the template to use later.”
“Definitely enjoyed the walk through of the excel pareto chart.”
Thank you to Dale Strong at Spinnaker Health Care Solutions for collaborating with us to develop this webinar and to ABBVIE for sponsoring the live workshop.

